Daily / Monthly Weather History From This Station
Daily Report for the month of July 2025
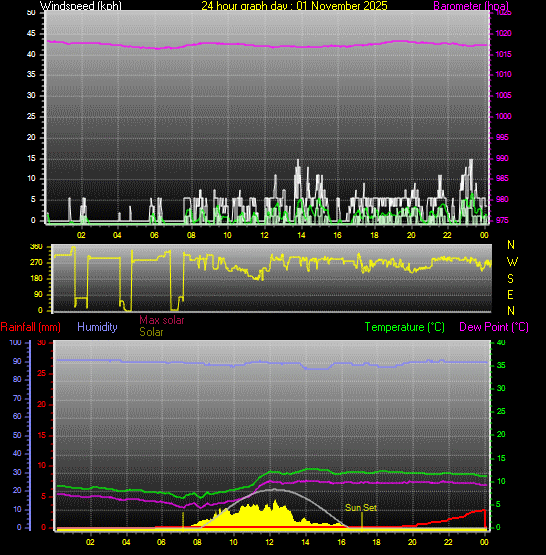
1 July Average and Extremes |
Average temperature | 26.5°C |
Average humidity | 64% |
Average dewpoint | 19.1°C |
Average barometer | 1014.6 hPa |
Average windspeed | 3.3 km/h |
Average gustspeed | 6.3 km/h |
Average direction | 138° (SE) |
Rainfall for month | 0.0 mm |
Rainfall for year | 486.6 mm |
Maximum rain per minute | 0.0 mm on 01 at 00:00 |
Maximum temperature | 33.9°C on 01 at 14:43 |
Minimum temperature | 21.2°C on 01 at 06:02 |
Maximum humidity | 73% on 01 at 22:07 |
Minimum humidity | 48% on 01 at 14:44 |
Maximum pressure | 1016.0 hPa on 01 at 09:40 |
Minimum pressure | 1013.2 hPa on 01 at 18:27 |
Maximum windspeed | 20.4 km/h on 01 at 16:12 |
Maximum gust speed | 31.5 km/h from 088°(E) on 01 at 15:37 |
Maximum heat index | 38.3°C on 01 at 14:42 |
Click here to toggle the 24 Hour Graph of this day
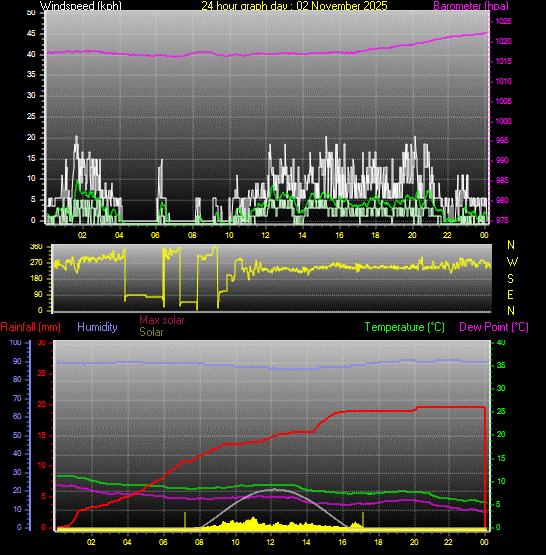
2 July Average and Extremes |
Average temperature | 26.9°C |
Average humidity | 61% |
Average dewpoint | 18.3°C |
Average barometer | 1013.5 hPa |
Average windspeed | 2.3 km/h |
Average gustspeed | 4.9 km/h |
Average direction | 243° (WSW) |
Rainfall for month | 0.0 mm |
Rainfall for year | 486.6 mm |
Maximum rain per minute | 0.0 mm on 02 at 23:59 |
Maximum temperature | 35.4°C on 02 at 17:27 |
Minimum temperature | 19.9°C on 02 at 06:00 |
Maximum humidity | 84% on 02 at 06:28 |
Minimum humidity | 33% on 02 at 17:10 |
Maximum pressure | 1015.0 hPa on 02 at 01:22 |
Minimum pressure | 1011.4 hPa on 02 at 18:21 |
Maximum windspeed | 9.3 km/h on 02 at 20:10 |
Maximum gust speed | 22.2 km/h from 193°(SSW) on 02 at 20:10 |
Maximum heat index | 38.2°C on 02 at 15:17 |
Click here to toggle the 24 Hour Graph of this day
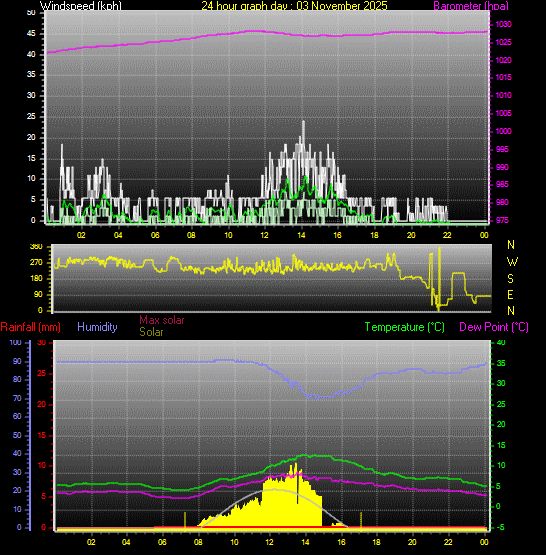
3 July Average and Extremes |
Average temperature | 24.3°C |
Average humidity | 68% |
Average dewpoint | 17.9°C |
Average barometer | 1018.4 hPa |
Average windspeed | 5.5 km/h |
Average gustspeed | 9.6 km/h |
Average direction | 20° (NNE) |
Rainfall for month | 0.0 mm |
Rainfall for year | 486.6 mm |
Maximum rain per minute | 0.0 mm on 03 at 23:59 |
Maximum temperature | 29.5°C on 03 at 17:37 |
Minimum temperature | 20.3°C on 03 at 06:21 |
Maximum humidity | 86% on 03 at 23:26 |
Minimum humidity | 54% on 03 at 15:55 |
Maximum pressure | 1021.1 hPa on 03 at 23:40 |
Minimum pressure | 1014.4 hPa on 03 at 00:06 |
Maximum windspeed | 20.4 km/h on 03 at 18:42 |
Maximum gust speed | 27.8 km/h from 093°(E) on 03 at 18:33 |
Maximum heat index | 31.7°C on 03 at 17:36 |
Click here to toggle the 24 Hour Graph of this day
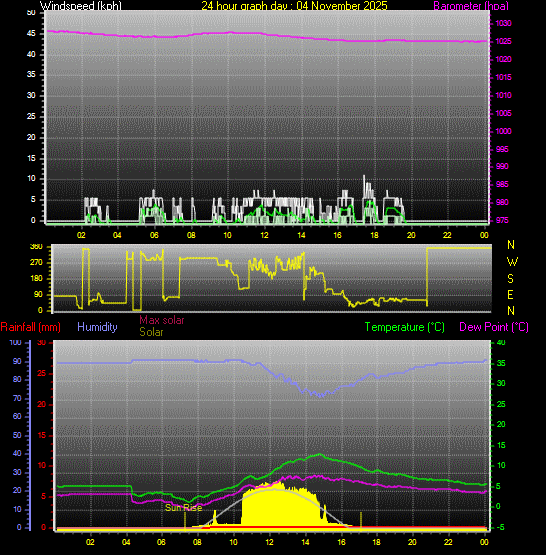
4 July Average and Extremes |
Average temperature | 22.0°C |
Average humidity | 73% |
Average dewpoint | 16.6°C |
Average barometer | 1021.4 hPa |
Average windspeed | 3.3 km/h |
Average gustspeed | 6.1 km/h |
Average direction | 16° (NNE) |
Rainfall for month | 4.2 mm |
Rainfall for year | 490.8 mm |
Maximum rain per minute | 0.6 mm on 04 at 03:46 |
Maximum temperature | 27.9°C on 04 at 17:42 |
Minimum temperature | 17.1°C on 04 at 06:40 |
Maximum humidity | 89% on 04 at 10:16 |
Minimum humidity | 52% on 04 at 23:04 |
Maximum pressure | 1023.8 hPa on 04 at 10:21 |
Minimum pressure | 1019.3 hPa on 04 at 20:10 |
Maximum windspeed | 16.7 km/h on 03 at 00:34 |
Maximum gust speed | 24.1 km/h from 086°(E) on 04 at 00:31 |
Maximum heat index | 28.7°C on 04 at 15:32 |
Click here to toggle the 24 Hour Graph of this day
5 July Average and Extremes |
Average temperature | 23.4°C |
Average humidity | 54% |
Average dewpoint | 13.2°C |
Average barometer | 1016.0 hPa |
Average windspeed | 3.8 km/h |
Average gustspeed | 7.4 km/h |
Average direction | 298° (WNW) |
Rainfall for month | 4.2 mm |
Rainfall for year | 490.8 mm |
Maximum rain per minute | 0.0 mm on 05 at 23:59 |
Maximum temperature | 29.6°C on 05 at 15:44 |
Minimum temperature | 17.0°C on 05 at 06:33 |
Maximum humidity | 72% on 05 at 07:21 |
Minimum humidity | 37% on 05 at 19:58 |
Maximum pressure | 1019.5 hPa on 05 at 00:03 |
Minimum pressure | 1013.2 hPa on 05 at 18:09 |
Maximum windspeed | 13.0 km/h on 05 at 16:54 |
Maximum gust speed | 24.1 km/h from 238°(WSW) on 05 at 16:04 |
Maximum heat index | 30.0°C on 05 at 15:41 |
Click here to toggle the 24 Hour Graph of this day
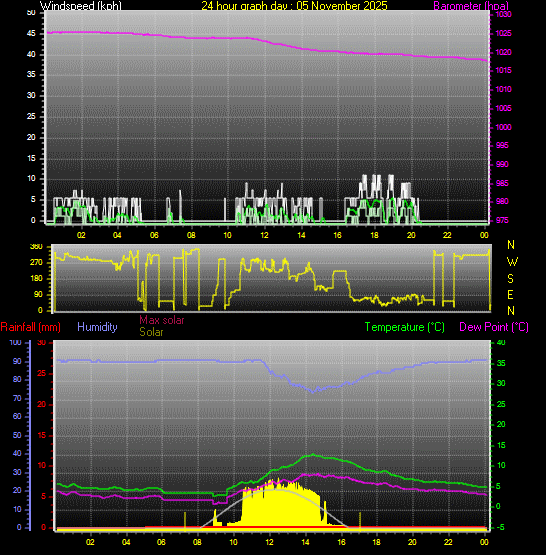
6 July Average and Extremes |
Average temperature | 19.8°C |
Average humidity | 61% |
Average dewpoint | 11.8°C |
Average barometer | 1010.1 hPa |
Average windspeed | 4.4 km/h |
Average gustspeed | 8.9 km/h |
Average direction | 270° (W) |
Rainfall for month | 5.4 mm |
Rainfall for year | 492.0 mm |
Maximum rain per minute | 0.2 mm on 06 at 22:12 |
Maximum temperature | 25.7°C on 06 at 11:49 |
Minimum temperature | 13.3°C on 06 at 23:59 |
Maximum humidity | 88% on 06 at 23:59 |
Minimum humidity | 47% on 06 at 11:41 |
Maximum pressure | 1013.7 hPa on 06 at 00:09 |
Minimum pressure | 1007.3 hPa on 06 at 18:47 |
Maximum windspeed | 22.2 km/h on 06 at 16:58 |
Maximum gust speed | 42.6 km/h from 266°(W) on 06 at 17:07 |
Maximum heat index | 26.4°C on 06 at 11:18 |
Click here to toggle the 24 Hour Graph of this day
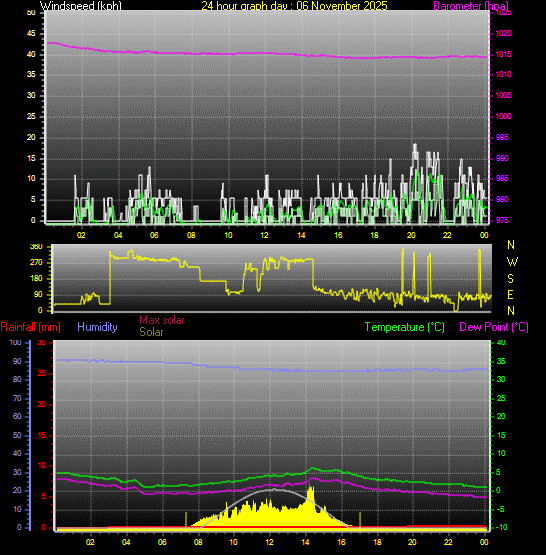
7 July Average and Extremes |
Average temperature | 13.5°C |
Average humidity | 87% |
Average dewpoint | 11.4°C |
Average barometer | 1007.8 hPa |
Average windspeed | 4.6 km/h |
Average gustspeed | 9.8 km/h |
Average direction | 249° (WSW) |
Rainfall for month | 22.6 mm |
Rainfall for year | 509.2 mm |
Maximum rain per minute | 0.4 mm on 07 at 13:04 |
Maximum temperature | 18.1°C on 07 at 15:25 |
Minimum temperature | 11.9°C on 07 at 23:35 |
Maximum humidity | 89% on 07 at 23:59 |
Minimum humidity | 83% on 07 at 15:35 |
Maximum pressure | 1010.9 hPa on 07 at 23:25 |
Minimum pressure | 1006.5 hPa on 07 at 14:49 |
Maximum windspeed | 16.7 km/h on 07 at 15:55 |
Maximum gust speed | 31.5 km/h from 303°(WNW) on 07 at 15:25 |
Maximum heat index | 18.1°C on 07 at 15:25 |
Click here to toggle the 24 Hour Graph of this day
8 July Average and Extremes |
Average temperature | 11.9°C |
Average humidity | 85% |
Average dewpoint | 9.4°C |
Average barometer | 1014.8 hPa |
Average windspeed | 3.7 km/h |
Average gustspeed | 8.4 km/h |
Average direction | 271° (W) |
Rainfall for month | 41.6 mm |
Rainfall for year | 528.2 mm |
Maximum rain per minute | 0.6 mm on 08 at 04:48 |
Maximum temperature | 16.8°C on 08 at 14:07 |
Minimum temperature | 9.1°C on 08 at 10:26 |
Maximum humidity | 90% on 08 at 12:07 |
Minimum humidity | 61% on 08 at 14:32 |
Maximum pressure | 1020.4 hPa on 08 at 23:59 |
Minimum pressure | 1010.4 hPa on 08 at 00:18 |
Maximum windspeed | 22.2 km/h on 08 at 14:44 |
Maximum gust speed | 31.5 km/h from 293°(WNW) on 08 at 14:47 |
Maximum heat index | 16.8°C on 08 at 14:07 |
Click here to toggle the 24 Hour Graph of this day
9 July Average and Extremes |
Average temperature | 15.3°C |
Average humidity | 72% |
Average dewpoint | 10.1°C |
Average barometer | 1021.2 hPa |
Average windspeed | 2.9 km/h |
Average gustspeed | 6.0 km/h |
Average direction | 298° (WNW) |
Rainfall for month | 41.6 mm |
Rainfall for year | 528.2 mm |
Maximum rain per minute | 0.0 mm on 09 at 23:59 |
Maximum temperature | 22.0°C on 09 at 17:47 |
Minimum temperature | 9.6°C on 09 at 05:58 |
Maximum humidity | 89% on 09 at 07:32 |
Minimum humidity | 51% on 09 at 18:03 |
Maximum pressure | 1022.2 hPa on 09 at 09:44 |
Minimum pressure | 1020.4 hPa on 09 at 01:29 |
Maximum windspeed | 11.1 km/h on 09 at 01:52 |
Maximum gust speed | 18.5 km/h from 303°(WNW) on 09 at 14:00 |
Maximum heat index | 25.0°C on 09 at 16:11 |
Click here to toggle the 24 Hour Graph of this day
10 July Average and Extremes |
Average temperature | 17.3°C |
Average humidity | 67% |
Average dewpoint | 10.6°C |
Average barometer | 1020.0 hPa |
Average windspeed | 5.0 km/h |
Average gustspeed | 8.4 km/h |
Average direction | 80° (E) |
Rainfall for month | 41.6 mm |
Rainfall for year | 528.2 mm |
Maximum rain per minute | 0.0 mm on 10 at 23:59 |
Maximum temperature | 24.2°C on 10 at 17:31 |
Minimum temperature | 9.9°C on 10 at 06:17 |
Maximum humidity | 88% on 10 at 06:35 |
Minimum humidity | 44% on 10 at 16:11 |
Maximum pressure | 1021.7 hPa on 10 at 00:07 |
Minimum pressure | 1018.4 hPa on 10 at 21:29 |
Maximum windspeed | 16.7 km/h on 10 at 11:48 |
Maximum gust speed | 24.1 km/h from 144°(SE) on 10 at 15:40 |
Maximum heat index | 25.4°C on 10 at 17:31 |
Click here to toggle the 24 Hour Graph of this day
11 July Average and Extremes |
Average temperature | 19.6°C |
Average humidity | 65% |
Average dewpoint | 12.5°C |
Average barometer | 1015.6 hPa |
Average windspeed | 1.9 km/h |
Average gustspeed | 3.8 km/h |
Average direction | 49° (NE) |
Rainfall for month | 41.6 mm |
Rainfall for year | 528.2 mm |
Maximum rain per minute | 0.0 mm on 11 at 23:59 |
Maximum temperature | 25.9°C on 11 at 14:06 |
Minimum temperature | 12.4°C on 11 at 05:54 |
Maximum humidity | 86% on 11 at 06:25 |
Minimum humidity | 48% on 11 at 14:08 |
Maximum pressure | 1018.5 hPa on 11 at 00:01 |
Minimum pressure | 1013.2 hPa on 11 at 20:10 |
Maximum windspeed | 11.1 km/h on 11 at 12:43 |
Maximum gust speed | 18.5 km/h from 085°(E) on 11 at 12:28 |
Maximum heat index | 26.4°C on 11 at 14:02 |
Click here to toggle the 24 Hour Graph of this day
12 July Average and Extremes |
Average temperature | 20.4°C |
Average humidity | 62% |
Average dewpoint | 12.4°C |
Average barometer | 1011.6 hPa |
Average windspeed | 4.8 km/h |
Average gustspeed | 8.4 km/h |
Average direction | 72° (ENE) |
Rainfall for month | 41.6 mm |
Rainfall for year | 528.2 mm |
Maximum rain per minute | 0.0 mm on 12 at 23:59 |
Maximum temperature | 26.8°C on 12 at 15:59 |
Minimum temperature | 13.4°C on 12 at 06:37 |
Maximum humidity | 85% on 12 at 06:38 |
Minimum humidity | 39% on 12 at 19:45 |
Maximum pressure | 1013.9 hPa on 12 at 00:21 |
Minimum pressure | 1009.7 hPa on 12 at 19:58 |
Maximum windspeed | 16.7 km/h on 12 at 01:39 |
Maximum gust speed | 22.2 km/h from 104°(ESE) on 12 at 01:39 |
Maximum heat index | 27.2°C on 12 at 15:59 |
Click here to toggle the 24 Hour Graph of this day
13 July Average and Extremes |
Average temperature | 22.3°C |
Average humidity | 62% |
Average dewpoint | 14.4°C |
Average barometer | 1010.7 hPa |
Average windspeed | 3.9 km/h |
Average gustspeed | 7.9 km/h |
Average direction | 259° (WSW) |
Rainfall for month | 41.6 mm |
Rainfall for year | 528.2 mm |
Maximum rain per minute | 0.0 mm on 13 at 23:59 |
Maximum temperature | 29.7°C on 13 at 15:59 |
Minimum temperature | 14.8°C on 13 at 06:21 |
Maximum humidity | 77% on 13 at 07:18 |
Minimum humidity | 45% on 13 at 17:21 |
Maximum pressure | 1013.3 hPa on 13 at 23:57 |
Minimum pressure | 1009.7 hPa on 13 at 18:47 |
Maximum windspeed | 16.7 km/h on 13 at 17:22 |
Maximum gust speed | 27.8 km/h from 258°(WSW) on 13 at 16:26 |
Maximum heat index | 30.6°C on 13 at 15:58 |
Click here to toggle the 24 Hour Graph of this day
14 July Average and Extremes |
Average temperature | 19.4°C |
Average humidity | 82% |
Average dewpoint | 16.3°C |
Average barometer | 1017.0 hPa |
Average windspeed | 4.0 km/h |
Average gustspeed | 7.8 km/h |
Average direction | 263° (W) |
Rainfall for month | 53.8 mm |
Rainfall for year | 540.4 mm |
Maximum rain per minute | 1.8 mm on 14 at 17:32 |
Maximum temperature | 25.1°C on 14 at 15:02 |
Minimum temperature | 15.5°C on 14 at 10:14 |
Maximum humidity | 89% on 14 at 12:28 |
Minimum humidity | 69% on 14 at 15:02 |
Maximum pressure | 1019.2 hPa on 14 at 10:59 |
Minimum pressure | 1013.2 hPa on 14 at 00:09 |
Maximum windspeed | 14.8 km/h on 14 at 17:34 |
Maximum gust speed | 31.5 km/h from 032°(NNE) on 14 at 17:32 |
Maximum heat index | 26.1°C on 14 at 15:02 |
Click here to toggle the 24 Hour Graph of this day
15 July Average and Extremes |
Average temperature | 19.2°C |
Average humidity | 81% |
Average dewpoint | 15.7°C |
Average barometer | 1018.6 hPa |
Average windspeed | 2.3 km/h |
Average gustspeed | 5.0 km/h |
Average direction | 284° (WNW) |
Rainfall for month | 62.8 mm |
Rainfall for year | 549.4 mm |
Maximum rain per minute | 0.6 mm on 15 at 04:16 |
Maximum temperature | 24.6°C on 15 at 17:55 |
Minimum temperature | 15.8°C on 15 at 09:31 |
Maximum humidity | 89% on 15 at 12:29 |
Minimum humidity | 63% on 15 at 17:59 |
Maximum pressure | 1019.8 hPa on 15 at 09:49 |
Minimum pressure | 1017.1 hPa on 15 at 19:13 |
Maximum windspeed | 13.0 km/h on 15 at 17:56 |
Maximum gust speed | 22.2 km/h from 321°(NW) on 15 at 18:15 |
Maximum heat index | 25.6°C on 15 at 17:55 |
Click here to toggle the 24 Hour Graph of this day
16 July Average and Extremes |
Average temperature | 18.4°C |
Average humidity | 75% |
Average dewpoint | 13.7°C |
Average barometer | 1017.0 hPa |
Average windspeed | 3.8 km/h |
Average gustspeed | 8.1 km/h |
Average direction | 263° (W) |
Rainfall for month | 63.4 mm |
Rainfall for year | 550.0 mm |
Maximum rain per minute | 0.2 mm on 16 at 19:26 |
Maximum temperature | 21.8°C on 16 at 15:10 |
Minimum temperature | 16.0°C on 16 at 05:42 |
Maximum humidity | 88% on 16 at 23:00 |
Minimum humidity | 63% on 16 at 15:10 |
Maximum pressure | 1019.2 hPa on 16 at 00:55 |
Minimum pressure | 1014.9 hPa on 16 at 17:37 |
Maximum windspeed | 13.0 km/h on 16 at 18:28 |
Maximum gust speed | 24.1 km/h from 277°(W) on 16 at 18:58 |
Maximum heat index | 24.2°C on 16 at 15:10 |
Click here to toggle the 24 Hour Graph of this day
17 July Average and Extremes |
Average temperature | 18.0°C |
Average humidity | 74% |
Average dewpoint | 13.1°C |
Average barometer | 1016.9 hPa |
Average windspeed | 2.4 km/h |
Average gustspeed | 5.2 km/h |
Average direction | 293° (WNW) |
Rainfall for month | 67.2 mm |
Rainfall for year | 553.8 mm |
Maximum rain per minute | 0.4 mm on 17 at 02:22 |
Maximum temperature | 24.4°C on 17 at 17:17 |
Minimum temperature | 11.7°C on 17 at 06:28 |
Maximum humidity | 89% on 17 at 09:24 |
Minimum humidity | 54% on 17 at 17:28 |
Maximum pressure | 1018.3 hPa on 17 at 08:57 |
Minimum pressure | 1016.0 hPa on 17 at 21:27 |
Maximum windspeed | 11.1 km/h on 17 at 18:15 |
Maximum gust speed | 24.1 km/h from 322°(NW) on 17 at 01:01 |
Maximum heat index | 25.6°C on 17 at 17:17 |
Click here to toggle the 24 Hour Graph of this day
18 July Average and Extremes |
Average temperature | 20.6°C |
Average humidity | 67% |
Average dewpoint | 14.0°C |
Average barometer | 1013.3 hPa |
Average windspeed | 3.1 km/h |
Average gustspeed | 5.7 km/h |
Average direction | 72° (ENE) |
Rainfall for month | 67.2 mm |
Rainfall for year | 553.8 mm |
Maximum rain per minute | 0.0 mm on 18 at 23:59 |
Maximum temperature | 27.9°C on 18 at 17:06 |
Minimum temperature | 13.3°C on 18 at 06:32 |
Maximum humidity | 88% on 18 at 06:49 |
Minimum humidity | 46% on 18 at 17:28 |
Maximum pressure | 1016.3 hPa on 18 at 00:24 |
Minimum pressure | 1010.5 hPa on 18 at 23:51 |
Maximum windspeed | 11.1 km/h on 18 at 12:30 |
Maximum gust speed | 18.5 km/h from 072°(ENE) on 18 at 12:29 |
Maximum heat index | 28.6°C on 18 at 17:03 |
Click here to toggle the 24 Hour Graph of this day
19 July Average and Extremes |
Average temperature | 19.8°C |
Average humidity | 80% |
Average dewpoint | 16.0°C |
Average barometer | 1009.2 hPa |
Average windspeed | 4.9 km/h |
Average gustspeed | 8.7 km/h |
Average direction | 70° (ENE) |
Rainfall for month | 73.6 mm |
Rainfall for year | 560.2 mm |
Maximum rain per minute | 0.2 mm on 19 at 23:08 |
Maximum temperature | 28.4°C on 19 at 13:20 |
Minimum temperature | 15.9°C on 19 at 05:53 |
Maximum humidity | 89% on 19 at 22:27 |
Minimum humidity | 58% on 19 at 14:21 |
Maximum pressure | 1011.3 hPa on 19 at 15:56 |
Minimum pressure | 1007.2 hPa on 19 at 13:00 |
Maximum windspeed | 18.5 km/h on 19 at 17:34 |
Maximum gust speed | 37.0 km/h from 273°(W) on 19 at 15:43 |
Maximum heat index | 30.0°C on 19 at 13:20 |
Click here to toggle the 24 Hour Graph of this day
20 July Average and Extremes |
Average temperature | 19.3°C |
Average humidity | 81% |
Average dewpoint | 15.8°C |
Average barometer | 1006.9 hPa |
Average windspeed | 2.8 km/h |
Average gustspeed | 5.4 km/h |
Average direction | 325° (NW) |
Rainfall for month | 91.0 mm |
Rainfall for year | 577.6 mm |
Maximum rain per minute | 0.6 mm on 20 at 19:32 |
Maximum temperature | 27.5°C on 20 at 15:43 |
Minimum temperature | 14.8°C on 20 at 23:59 |
Maximum humidity | 88% on 20 at 21:59 |
Minimum humidity | 55% on 20 at 16:26 |
Maximum pressure | 1009.7 hPa on 20 at 00:24 |
Minimum pressure | 1004.2 hPa on 20 at 18:38 |
Maximum windspeed | 16.7 km/h on 20 at 19:57 |
Maximum gust speed | 33.3 km/h from 327°(NNW) on 20 at 19:57 |
Maximum heat index | 29.0°C on 20 at 15:31 |
Click here to toggle the 24 Hour Graph of this day
21 July Average and Extremes |
Average temperature | 17.7°C |
Average humidity | 79% |
Average dewpoint | 14.0°C |
Average barometer | 1008.2 hPa |
Average windspeed | 2.1 km/h |
Average gustspeed | 5.0 km/h |
Average direction | 230° (SW) |
Rainfall for month | 94.8 mm |
Rainfall for year | 581.4 mm |
Maximum rain per minute | 0.2 mm on 21 at 15:43 |
Maximum temperature | 22.6°C on 21 at 14:40 |
Minimum temperature | 14.7°C on 21 at 01:00 |
Maximum humidity | 89% on 21 at 12:46 |
Minimum humidity | 66% on 21 at 17:22 |
Maximum pressure | 1010.6 hPa on 21 at 23:59 |
Minimum pressure | 1006.7 hPa on 21 at 05:08 |
Maximum windspeed | 11.1 km/h on 21 at 20:56 |
Maximum gust speed | 24.1 km/h from 259°(W) on 21 at 21:15 |
Maximum heat index | 24.1°C on 21 at 17:20 |
Click here to toggle the 24 Hour Graph of this day
22 July Average and Extremes |
Average temperature | 18.2°C |
Average humidity | 75% |
Average dewpoint | 13.6°C |
Average barometer | 1013.3 hPa |
Average windspeed | 4.9 km/h |
Average gustspeed | 11.0 km/h |
Average direction | 270° (W) |
Rainfall for month | 100.0 mm |
Rainfall for year | 586.6 mm |
Maximum rain per minute | 0.6 mm on 22 at 04:29 |
Maximum temperature | 23.7°C on 22 at 18:16 |
Minimum temperature | 13.1°C on 22 at 06:31 |
Maximum humidity | 89% on 22 at 10:28 |
Minimum humidity | 56% on 22 at 18:34 |
Maximum pressure | 1015.7 hPa on 22 at 23:22 |
Minimum pressure | 1010.6 hPa on 22 at 00:01 |
Maximum windspeed | 14.8 km/h on 22 at 18:28 |
Maximum gust speed | 31.5 km/h from 268°(W) on 22 at 14:34 |
Maximum heat index | 25.2°C on 22 at 18:16 |
Click here to toggle the 24 Hour Graph of this day
23 July Average and Extremes |
Average temperature | 19.1°C |
Average humidity | 72% |
Average dewpoint | 13.6°C |
Average barometer | 1013.1 hPa |
Average windspeed | 1.9 km/h |
Average gustspeed | 4.0 km/h |
Average direction | 328° (NNW) |
Rainfall for month | 100.8 mm |
Rainfall for year | 587.4 mm |
Maximum rain per minute | 0.2 mm on 23 at 23:58 |
Maximum temperature | 24.8°C on 23 at 16:31 |
Minimum temperature | 13.7°C on 23 at 05:36 |
Maximum humidity | 88% on 23 at 07:29 |
Minimum humidity | 52% on 23 at 16:33 |
Maximum pressure | 1015.9 hPa on 23 at 00:47 |
Minimum pressure | 1010.6 hPa on 23 at 23:14 |
Maximum windspeed | 11.1 km/h on 23 at 14:45 |
Maximum gust speed | 18.5 km/h from 246°(WSW) on 23 at 15:41 |
Maximum heat index | 25.8°C on 23 at 15:08 |
Click here to toggle the 24 Hour Graph of this day
24 July Average and Extremes |
Average temperature | 16.0°C |
Average humidity | 86% |
Average dewpoint | 13.7°C |
Average barometer | 1012.5 hPa |
Average windspeed | 2.4 km/h |
Average gustspeed | 5.1 km/h |
Average direction | 286° (WNW) |
Rainfall for month | 106.0 mm |
Rainfall for year | 592.6 mm |
Maximum rain per minute | 0.6 mm on 24 at 07:26 |
Maximum temperature | 19.2°C on 24 at 16:39 |
Minimum temperature | 13.9°C on 24 at 23:59 |
Maximum humidity | 89% on 24 at 23:59 |
Minimum humidity | 78% on 24 at 18:39 |
Maximum pressure | 1015.8 hPa on 24 at 23:56 |
Minimum pressure | 1010.6 hPa on 24 at 05:46 |
Maximum windspeed | 14.8 km/h on 24 at 19:11 |
Maximum gust speed | 22.2 km/h from 283°(WNW) on 24 at 19:10 |
Maximum heat index | 19.2°C on 24 at 16:39 |
Click here to toggle the 24 Hour Graph of this day
25 July Average and Extremes |
Average temperature | 15.6°C |
Average humidity | 84% |
Average dewpoint | 12.8°C |
Average barometer | 1015.3 hPa |
Average windspeed | 2.1 km/h |
Average gustspeed | 4.2 km/h |
Average direction | 50° (NE) |
Rainfall for month | 112.8 mm |
Rainfall for year | 599.4 mm |
Maximum rain per minute | 1.2 mm on 25 at 01:37 |
Maximum temperature | 21.8°C on 25 at 17:02 |
Minimum temperature | 12.2°C on 25 at 06:17 |
Maximum humidity | 89% on 25 at 12:56 |
Minimum humidity | 67% on 25 at 17:04 |
Maximum pressure | 1016.3 hPa on 25 at 23:10 |
Minimum pressure | 1014.3 hPa on 25 at 17:51 |
Maximum windspeed | 14.8 km/h on 25 at 13:50 |
Maximum gust speed | 18.5 km/h from 063°(ENE) on 25 at 17:00 |
Maximum heat index | 23.8°C on 25 at 17:03 |
Click here to toggle the 24 Hour Graph of this day
26 July Average and Extremes |
Average temperature | 16.0°C |
Average humidity | 87% |
Average dewpoint | 13.7°C |
Average barometer | 1015.2 hPa |
Average windspeed | 2.4 km/h |
Average gustspeed | 5.0 km/h |
Average direction | 286° (WNW) |
Rainfall for month | 121.6 mm |
Rainfall for year | 608.2 mm |
Maximum rain per minute | 0.2 mm on 26 at 21:46 |
Maximum temperature | 22.9°C on 26 at 15:16 |
Minimum temperature | 13.1°C on 26 at 23:59 |
Maximum humidity | 90% on 26 at 07:11 |
Minimum humidity | 71% on 26 at 15:18 |
Maximum pressure | 1017.1 hPa on 26 at 22:56 |
Minimum pressure | 1013.4 hPa on 26 at 16:07 |
Maximum windspeed | 18.5 km/h on 26 at 16:40 |
Maximum gust speed | 31.5 km/h from 084°(E) on 26 at 16:39 |
Maximum heat index | 24.0°C on 26 at 15:16 |
Click here to toggle the 24 Hour Graph of this day
27 July Average and Extremes |
Average temperature | 15.8°C |
Average humidity | 85% |
Average dewpoint | 13.3°C |
Average barometer | 1014.1 hPa |
Average windspeed | 2.6 km/h |
Average gustspeed | 5.8 km/h |
Average direction | 241° (WSW) |
Rainfall for month | 129.2 mm |
Rainfall for year | 615.8 mm |
Maximum rain per minute | 1.0 mm on 27 at 14:06 |
Maximum temperature | 22.2°C on 27 at 16:25 |
Minimum temperature | 12.9°C on 27 at 23:59 |
Maximum humidity | 89% on 27 at 23:53 |
Minimum humidity | 71% on 27 at 16:49 |
Maximum pressure | 1016.9 hPa on 27 at 00:02 |
Minimum pressure | 1011.8 hPa on 27 at 16:59 |
Maximum windspeed | 16.7 km/h on 27 at 14:03 |
Maximum gust speed | 31.5 km/h from 289°(WNW) on 27 at 14:02 |
Maximum heat index | 23.3°C on 27 at 16:26 |
Click here to toggle the 24 Hour Graph of this day
28 July Average and Extremes |
Average temperature | 12.5°C |
Average humidity | 86% |
Average dewpoint | 10.2°C |
Average barometer | 1015.1 hPa |
Average windspeed | 3.2 km/h |
Average gustspeed | 6.5 km/h |
Average direction | 263° (W) |
Rainfall for month | 178.8 mm |
Rainfall for year | 665.4 mm |
Maximum rain per minute | 3.2 mm on 28 at 07:34 |
Maximum temperature | 14.2°C on 28 at 13:53 |
Minimum temperature | 11.3°C on 28 at 07:56 |
Maximum humidity | 88% on 28 at 23:01 |
Minimum humidity | 83% on 28 at 14:28 |
Maximum pressure | 1020.1 hPa on 28 at 22:36 |
Minimum pressure | 1011.5 hPa on 28 at 03:30 |
Maximum windspeed | 11.1 km/h on 28 at 14:35 |
Maximum gust speed | 20.4 km/h from 301°(WNW) on 28 at 15:13 |
Maximum heat index | 14.2°C on 28 at 13:53 |
Click here to toggle the 24 Hour Graph of this day
29 July Average and Extremes |
Average temperature | 14.6°C |
Average humidity | 82% |
Average dewpoint | 11.6°C |
Average barometer | 1019.2 hPa |
Average windspeed | 1.4 km/h |
Average gustspeed | 3.1 km/h |
Average direction | 251° (WSW) |
Rainfall for month | 180.0 mm |
Rainfall for year | 666.6 mm |
Maximum rain per minute | 0.2 mm on 29 at 14:44 |
Maximum temperature | 20.4°C on 29 at 18:02 |
Minimum temperature | 10.8°C on 29 at 05:54 |
Maximum humidity | 90% on 29 at 10:52 |
Minimum humidity | 66% on 29 at 18:05 |
Maximum pressure | 1020.3 hPa on 29 at 00:53 |
Minimum pressure | 1017.5 hPa on 29 at 19:27 |
Maximum windspeed | 7.4 km/h on 29 at 18:41 |
Maximum gust speed | 16.7 km/h from 236°(SW) on 29 at 14:20 |
Maximum heat index | 23.8°C on 29 at 18:05 |
Click here to toggle the 24 Hour Graph of this day
Average and Extremes for Month of July 2025 up to day 29 |
Average temperature | 18.7°C |
Average humidity | 74% |
Average dewpoint | 13.7°C |
Average barometer | 1014.5 hPa |
Average windspeed | 3.3 km/h |
Average gustspeed | 6.6 km/h |
Average direction | 280° (W) |
Rainfall for month | 180.0 mm |
Rainfall for year | 666.6 mm |
Maximum rain per minute | 3.2 mm on 28 at 07:34 |
Maximum temperature | 35.4°C on 02 at 17:27 |
Minimum temperature | 9.1°C on 08 at 10:26 |
Maximum humidity | 90% on 29 at 10:52 |
Minimum humidity | 33% on 02 at 17:10 |
Maximum pressure | 1023.8 hPa on 04 at 10:21 |
Minimum pressure | 1004.2 hPa on 20 at 18:38 |
Maximum windspeed | 22.2 kmh from 276°(W) on 08 at 14:44 |
Maximum gust speed | 42.6 km/h from 248°(WSW) on 06 at 17:07 |
Maximum heat index | 38.3°C on 01 at 14:42 |
Avg daily max temp | 24.7°C |
Avg daily min temp | 14.1°C |
Growing degrees days | 269.1 GDD |
Day, Sunshine Hours, ET, Max Solar, UV |
01 13:00hrs |
ET :7.1 mm |
1034.0 W/mē |
|
02 13:48hrs |
ET :7.4 mm |
884.0 W/mē |
|
03 09:48hrs |
ET :6.2 mm |
1100.0 W/mē |
|
04 07:24hrs |
ET :4.7 mm |
1049.0 W/mē |
|
05 14:00hrs |
ET :6.2 mm |
891.0 W/mē |
|
06 05:30hrs |
ET :4.0 mm |
1127.0 W/mē |
|
07 00:48hrs |
ET :1.8 mm |
635.0 W/mē |
|
08 04:30hrs |
ET :2.8 mm |
1121.0 W/mē |
|
09 09:36hrs |
ET :4.6 mm |
1229.0 W/mē |
|
10 13:48hrs |
ET :5.6 mm |
1000.0 W/mē |
|
11 10:30hrs |
ET :4.3 mm |
1132.0 W/mē |
|
12 12:18hrs |
ET :5.8 mm |
947.0 W/mē |
|
13 11:12hrs |
ET :5.9 mm |
979.0 W/mē |
|
14 04:36hrs |
ET :3.4 mm |
1150.0 W/mē |
|
15 03:24hrs |
ET :3.2 mm |
1044.0 W/mē |
|
16 00:24hrs |
ET :3.1 mm |
679.0 W/mē |
|
17 08:42hrs |
ET :4.0 mm |
1136.0 W/mē |
|
18 12:42hrs |
ET :5.2 mm |
858.0 W/mē |
|
19 05:54hrs |
ET :4.5 mm |
930.0 W/mē |
|
20 02:30hrs |
ET :3.9 mm |
956.0 W/mē |
|
21 05:06hrs |
ET :3.2 mm |
1071.0 W/mē |
|
22 08:06hrs |
ET :4.7 mm |
1092.0 W/mē |
|
23 08:18hrs |
ET :4.2 mm |
1020.0 W/mē |
|
24 00:36hrs |
ET :1.8 mm |
784.0 W/mē |
|
25 02:48hrs |
ET :2.6 mm |
1155.0 W/mē |
|
26 01:00hrs |
ET :2.4 mm |
1172.0 W/mē |
|
27 01:48hrs |
ET :2.8 mm |
1085.0 W/mē |
|
28 00:30hrs |
ET :1.3 mm |
550.0 W/mē |
|
29 03:48hrs |
ET :2.9 mm |
1121.0 W/mē |
|
Daily Rain Totals |
04.2 mm on 4 |
01.2 mm on 6 |
17.2 mm on 7 |
19.0 mm on 8 |
12.2 mm on 14 |
09.0 mm on 15 |
00.6 mm on 16 |
03.8 mm on 17 |
06.4 mm on 19 |
17.4 mm on 20 |
03.8 mm on 21 |
05.2 mm on 22 |
00.8 mm on 23 |
05.2 mm on 24 |
06.8 mm on 25 |
08.8 mm on 26 |
07.6 mm on 27 |
49.6 mm on 28 |
01.2 mm on 29 |